Have you ever opened a position only for the price to immediately move against you, crushing your trade as if the market were a malignant intelligence lurking to destroy you? It happens, and it's often because you bought too close to a resistance or sold too close to a support.
1. The Psychological Basis of Resistance (Supply Pressure)
Currency prices constantly fluctuate, reflecting the shifting expectations of traders regarding the relative strength of different economies. Sometimes, a currency pair rises consistently, but upon reaching a critical level, it stops and then moves back, as if that price constitutes a barrier.
If this rejection is repeated several times, that critical price is formally recognized as Resistance. More than an exact fixed price, a resistance is usually a narrow price zone that the market struggles to overcome.
This behavior is rooted in widespread market consensus: the prevailing belief is that the currency can no longer appreciate. This triggers two major actions:
- Those who bought lower are now selling for profit.
- Potential buyers refrain from entering because they fear the reversal.
This creates a temporary excess of supply and a demand deficit, causing the price to fall back. A resistance signals a price where the smart move is not to buy, but to look for selling opportunities.
2. The Market Consensus: Defining Support (Demand Zone)
The opposite phenomenon occurs during downward moves. As the price falls to a certain limit, sellers lose interest because they would be selling at a loss, while buyers believe the currency is already very cheap and rush to buy what they see as a bargain.
The resulting supply deficit and surge in demand stops the price fall and reverses the trend. If this is repeated several times at the same level, it is called a Support—a price zone that prevents the price from falling lower.
Experienced traders are keenly aware of these Support and Resistance levels and factor them into their operations. Anyone who buys near a resistance level runs a greater-than-normal risk of loss, just as it is reckless to sell short near a strong support due to the greater probability of a rebound.
3. S&R Role Reversal: The Probability Zones
It is vital to understand that S&R levels are not impassable or insurmountable barriers. They are only price zones in which the probability of a reversal or setback is significantly greater than that of continuation.
In fact, a reversal can occur at any time and at any price. A price level is considered significant only when the stop or setback has happened repeatedly, revealing that this price level receives special, shared consideration from market operators. Because these are beliefs shared by a very large number of traders, these concepts become something like self-fulfilling prophecies—the price turns back because enough people believe it will turn back.
When Resistance Becomes Support (The S&R Flip)
One of the most powerful concepts in technical analysis is Role Reversal (or the S&R Flip). When a strong Resistance level is finally broken by price continuation, that level often flips its role and subsequently acts as a new Support level when the price retraces. The same mechanism applies when a Support level is broken; it often becomes the new Resistance.
💰 Profitable Strategy Basis
This phenomenon provides the basis for a foundational winning strategy: buy the support after the recovery, and sell the resistance after the drop. This strategy is also ideal because the S&R line allows you to use a very small stop-loss, keeping losses small, while successful gains can be much larger.
4. Defining S&R: Manual Method vs. Automation
For a strategy based on support and resistance to be reliably profitable, it is essential that these levels have been correctly and consistently defined. And this is where the difficulty lies: prices are constantly moving, generating subjective peaks and troughs that may not represent a true, shared market consensus.
Manual Identification
One way to plot these levels effectively on a MetaTrader chart is as follows:
- Zoom Out: Compress the chart horizontally as much as possible to see maximum historical data.
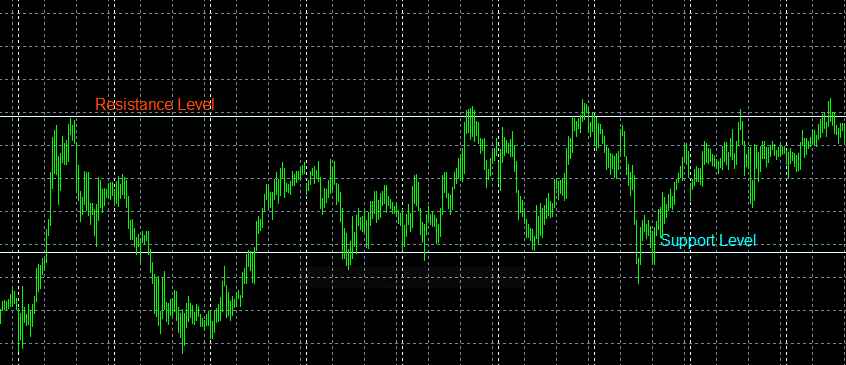
- Identify Resistance: Click the horizontal line tool and drag it, looking for a price level above the current price where the line "touches" or aligns with the greatest number of maximum price peaks. That will be the resistance level closest to the current price.
- Identify Support: Repeat the operation, dragging a new horizontal line to a level below the current price, aligning it with the greatest number of minimum troughs. That will be the support level.
Laying out these levels manually is largely subjective and requires practice, but the core principle is well within everyone's reach.
The Need for Precision
While the manual method is a great start for technical analysis, trading successfully with S&R requires a quantitative, objective, and non-negotiable definition of these zones. What one trader sees as a peak, another may discount. To overcome this subjectivity and ensure your trading decisions are based on the most statistically valid price levels, you need professional tools.